
Page 94 - TAIWAN TOBACCO CONTROL ANNUAL REPORT 2019
P. 94
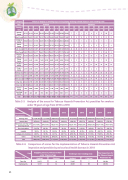
92 Category Failure to display no smoking signs and supplying smoking-related objects in non-smoking areas Year Audited Citations 2018 2010 2011 2012 2013 2014 2015 2016 2017 2018 County/ 2010 2011 City Hsinchu County 2012 2013 2014 2015 30,414 20,138 18,540 15,169 22,297 15,757 16,124 14,283 37,165 32,091 35,170 38,385 36,407 28,676 25,448 32,726 18,077 21,564 21,687 20,987 28,171 16,637 15,316 15,227 2016 2017 17,393 22,588 9,633 12,853 29,765 26,812 36,224 29,081 17,413 18,748 11,418 17,779 Taitung County Hualien County Penghu County Keelung City Hsinchu City 21 26 16 4 0 1 5 0 Taichung City 137,898 97,306 12,275 46,501 105,545 102,606 10,854 16,427 51,776 73,008 2 0 108 92 795 11 18 65 29 35 Chiayi City Tainan City Kinmen County Lienchiang County Total 22,322 33,789 Table 2-5 Commonsite of violations Smoking areas Internet cafes Elementary, junior high, and senior high schools Bus / train stations Hospitals Colleges and universities Others Total Table 2-6 item County / City Taipei City Kaohsiung City Supplying tobacco products to those under 18 years of age Audited Citations 21,675 10 14,707 32 Smoking in non-smoking areas Audited Citations 71,495 7 49,088 961 Total inspections for the Tobacco Hazards Prevention Act 345,424 238,912 10,733 14,134 15,983 7 11,848 10 28,500 0 30,884 5 113425 28 2 Miaoli County 6,304 6,300 Changhua 19,828 12,547 County Nantou County Yunlin County Chiayi County 9126 10 612 2 761 6 10 0 31 2 0 1 1 4 5 4 6 4 5,484 17,513 8,756 10,259 5,823 12,232 18,005 16,165 12,746 13,025 93,659 12,632 53,927 444630 47 17 2 19 27 0 0 16 27 60 3 58 11 30 3 60 12 00 15 12 0 0 1 1 2,579 3,018 6,876 4,072 4,282 4,214 3,077 2,765 2,159 0 0 0 1 9 17 0 0 0 0 2 0 7 3 Pingtung 15,302 16,608 County 16 0 4 7 38,993 46,799 48,075 48,691 4,250 5,416 6,364 7,548 8,276 8,605 5,920 9,534 8,453 10,076 15,768 13,496 14,467 13,622 13,163 15,850 14,812 5,034 17,036 5,699 84,455 3,759 29,424 12,979 12,717 12,937 27,499 12,457 9,593 170,259 115,483 120,794 14,900 14,366 18,152 71,348 78,799 52,761 14,256 16,644 19,108 11,057 8,690 14,507 15 6 0 0 118 212 14 24 0 0 76 44 5 21 116 258 23 32 20 0 14 0 52 59 39 9 0 10 76 170 138 45,740 37,411 37,984 10,063 16,150 7 10 938 3,060 2,589 1,531 1,577 1,146 1,515 1,661 1,550 1 1 0 5 1 3 0 0 1 397 446 467 376 383 361 599 806 917 0 0 0 0 0 0 0 0 0 436,010 412,157 1,052,748 739,906 721,945 627,896 631,753 702,659 616,858 470 778 535 506 542 663 449 856 645 Analysis of the areas for Tobacco Hazards Prevention Act penalties for smokers under 18 years of age from 2010 to 2018 Year 2010 2011 2012 2013 2014 2015 2016 2017 2018 3,147(80.70%) 2,171(72.80%) 1,838(58.90%) 1,675(64.70%) 1,737(56.50%) 2,456(64.60%) 1,982(59.80%) 950(46.40%) 1,291(56.30%) 327(8.4%) 291(7.50%) 190(6.4%) 504(16.90%) 236(7.6%) 739(23.70%) 119(4.6%) 670(25.90%) 142(4.6%) 852(27.70%) 16(0.5%) 0(0.0%) 223(7.3%) 102(3.3%) 3,899(100%) 2,985(100%) 3,123(100%) 2,590(100%) 3,072(100%) 3,799(100%) 3,314(100%) 2,002(100%) 2,374(100%) 21(0.5%) 1(0.0%) 4(0.0%) 108(2.90%) 8(0.3%) 3(0.1%) 1(0.0%) 108(3.60%) 14(0.4%) 0(0.0%) 2(0.1%) 294(9.3%) 3(0.1%) 0(0.0%) 28(1.1%) 95(3.7%) 11(0.3%) 0(0.0%) 85(2.2%) 150(3.9%) 14(0.4%) 0(0.0%) 61(1.8%) 161(4.9%) 20(1.7%) 42(3.7%) 57(2.8%) 161(4.9%) 16(0.7%) 0(0.0%) 29(1.3%) 184(8.00%) Comparison of scores for the implementation of Tobacco Hazards Prevention Act inspection and penalties by various local health bureaus in 2018 103(2.7%) 994(26.20%) 96(2.9%) 1,000(30.20%) 66(3.2%) 855(41.70%) 67(2.9%) 787(34.30%)
